Results Overview
Figure 1. Population density in in villages of Mara region; Serengeti National Park is shown in grey
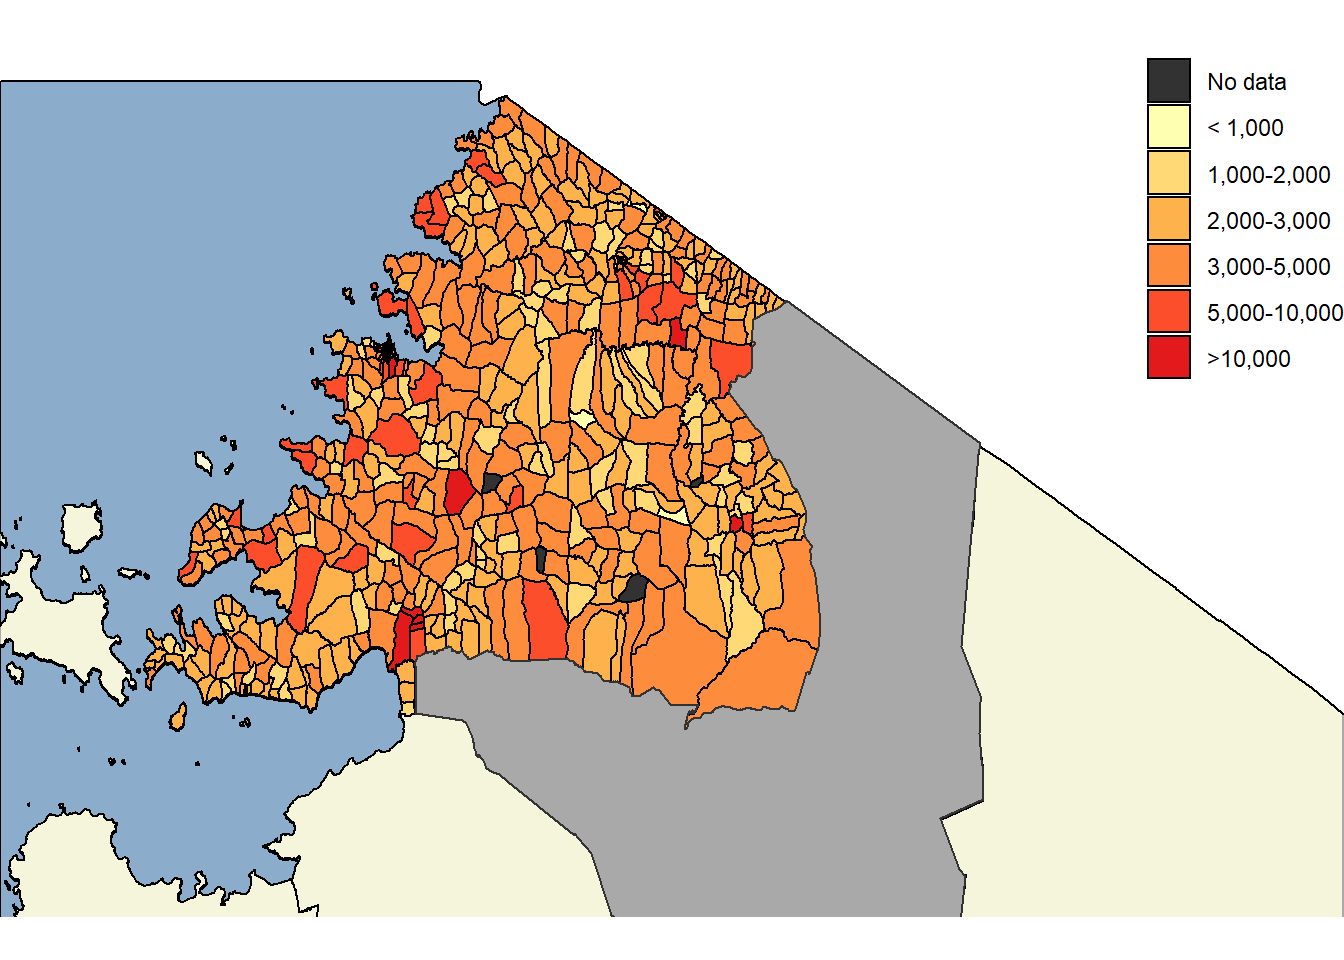
This plot is in development and currently uses randomly generated data.
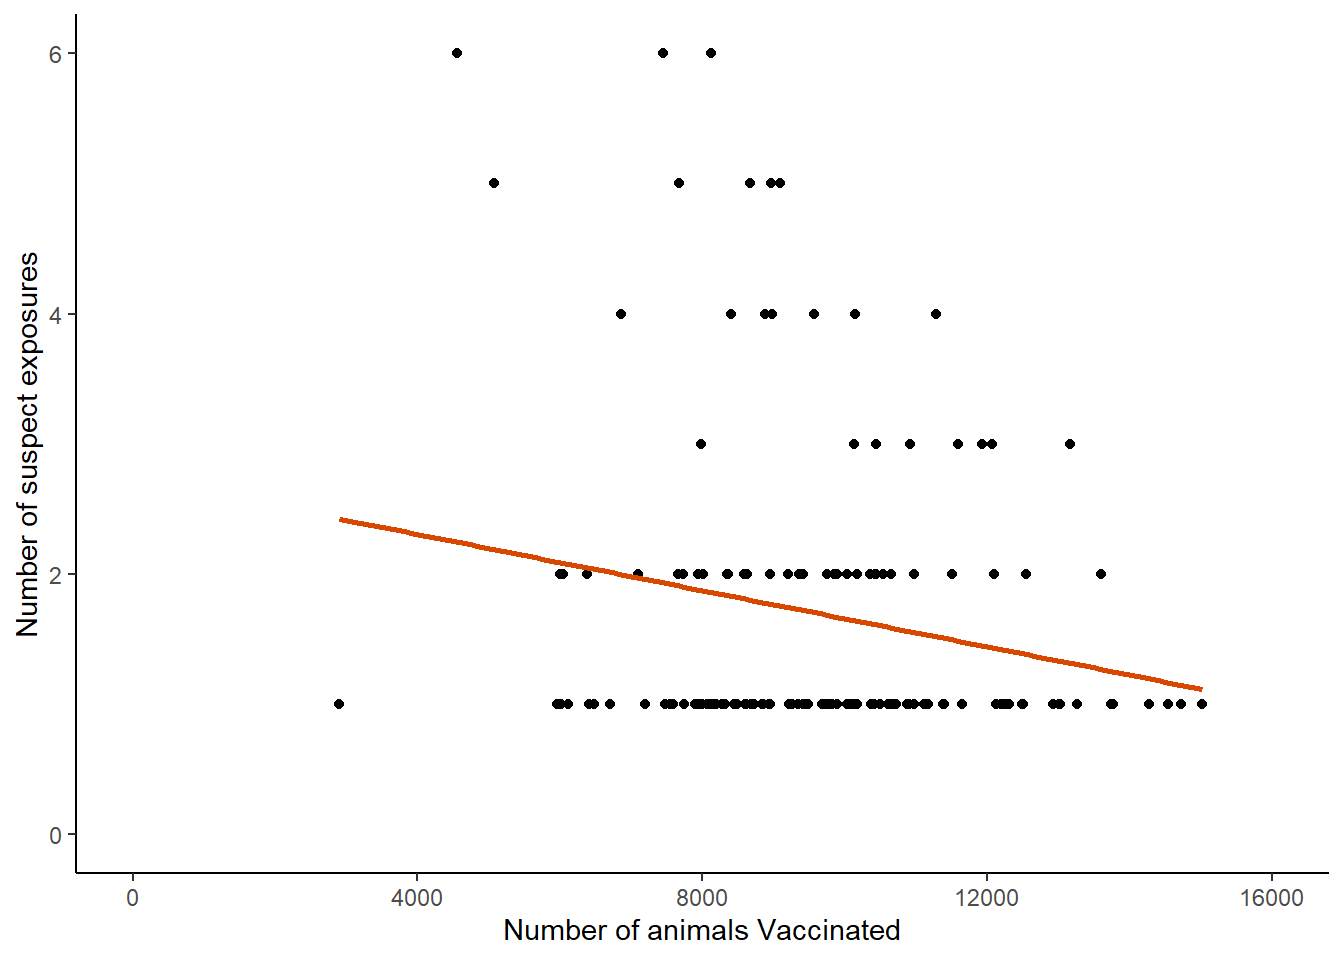
Figure 2. Comparison of the number of animals vaccinated (dogs & cats) versus the number of suspect human Rabies exposures in individual villages of Mara Region.